Reports & Queries
This option enables user to generate reports for Inventory Management.
Reports Can be sent to a Preview Screen or to Printer by clicking the respective printer or preview button.
STOCK STATUS QUERY
What is Stock Status Query?
If the user requires a screen that will tell in one glance, the stock status, Uniq365 will answer their needs. This report also features a series of “zoom-in” screens that allows you to drill down to the transaction level.
How to use Stock Status Query?
1. Click on Stock – Stock Operations – Reports & Queries - Stock Status Query icon for following screen.
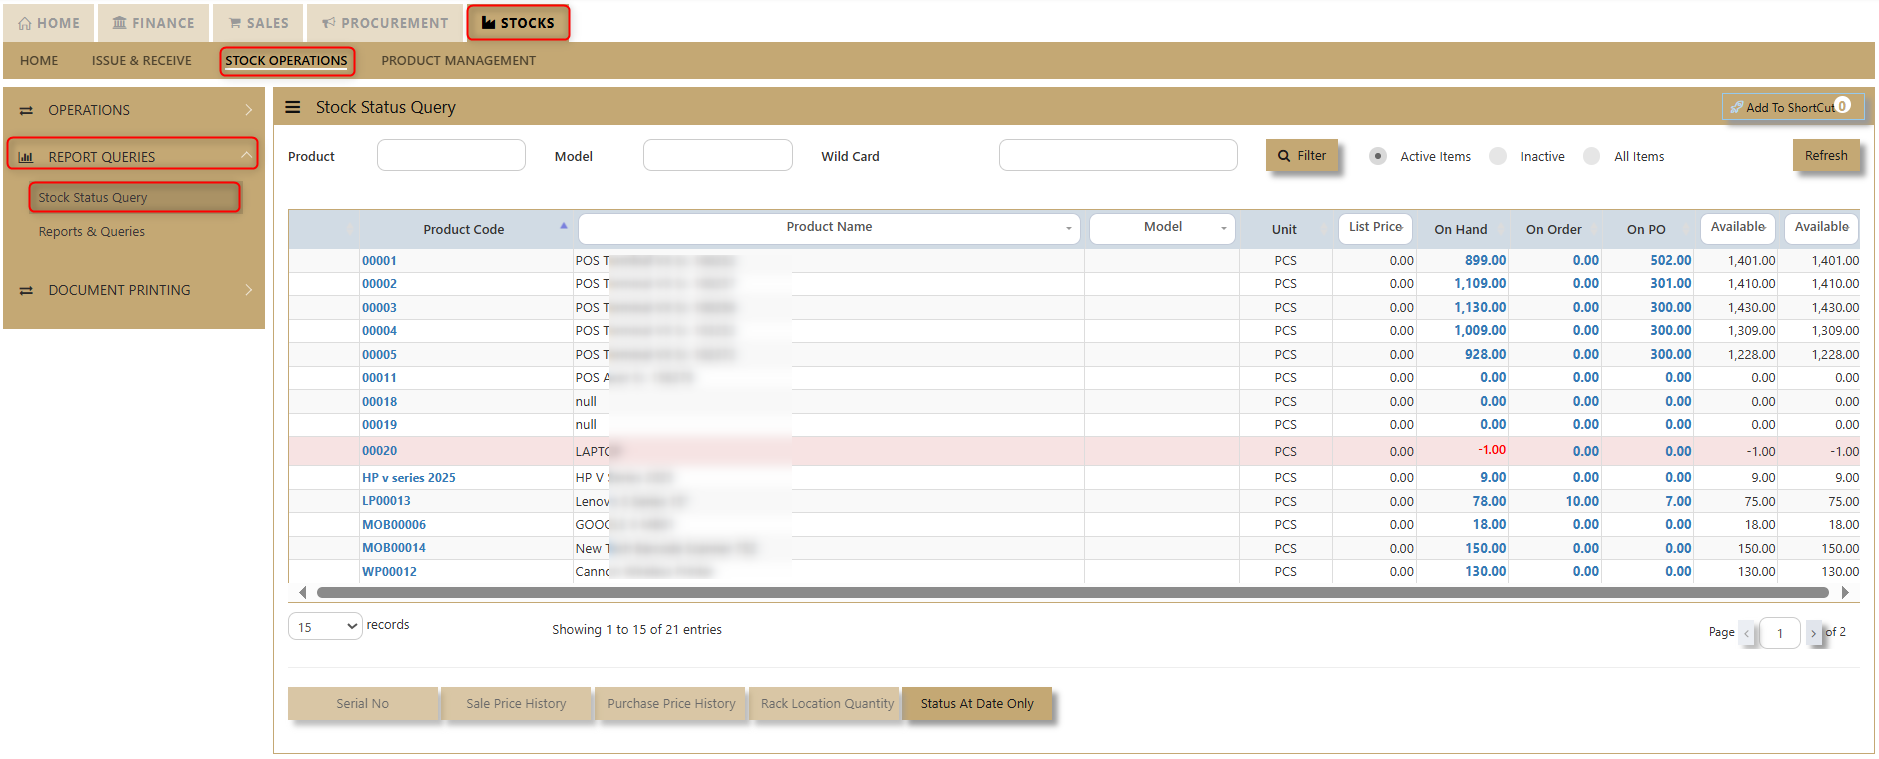
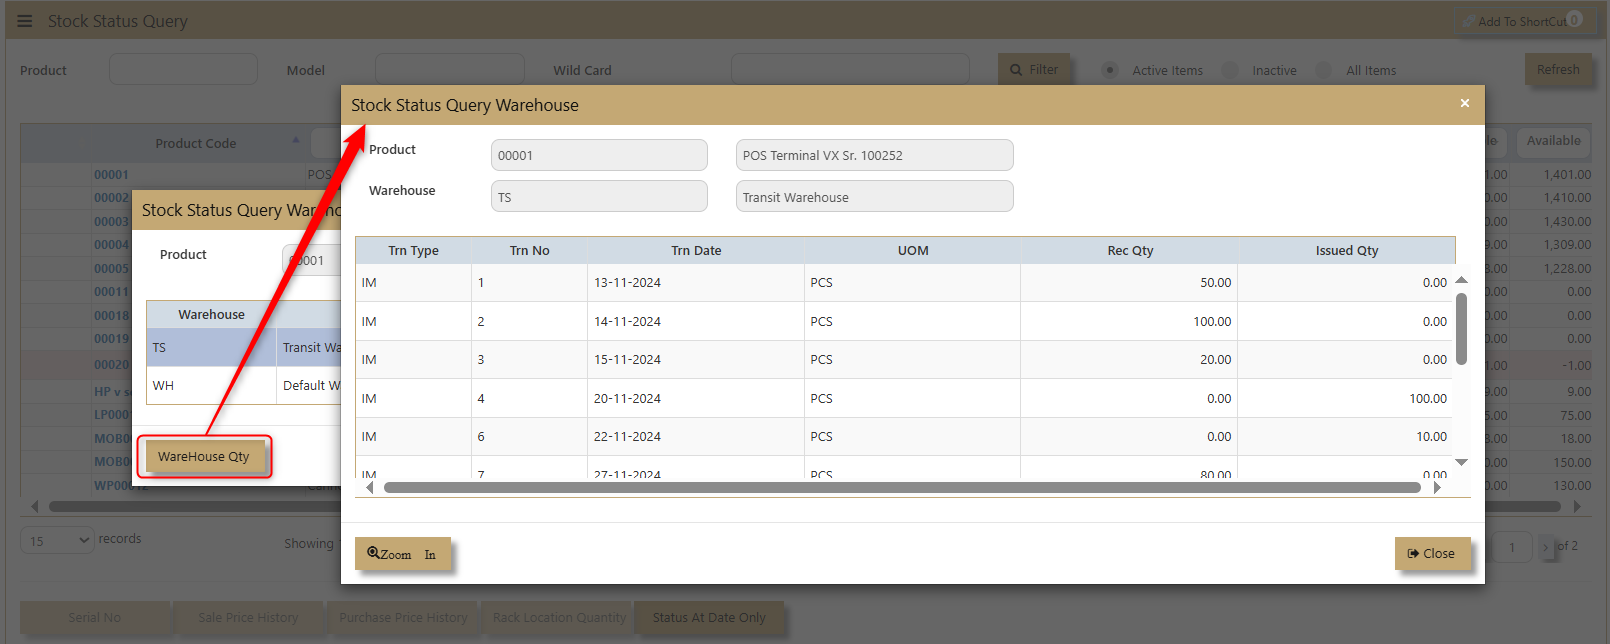
2. Assuming user want to see the status of say Product Code “00001” that reflect an available balance of 899 PCS. Simply click the side bar (as shown by example in above graphic) to select “00001”. Click on the on hand Qty then select the Warehouse to see the Warehouse Quantity in each warehouse. A pop-up window showing the product balance by warehouse will appear.
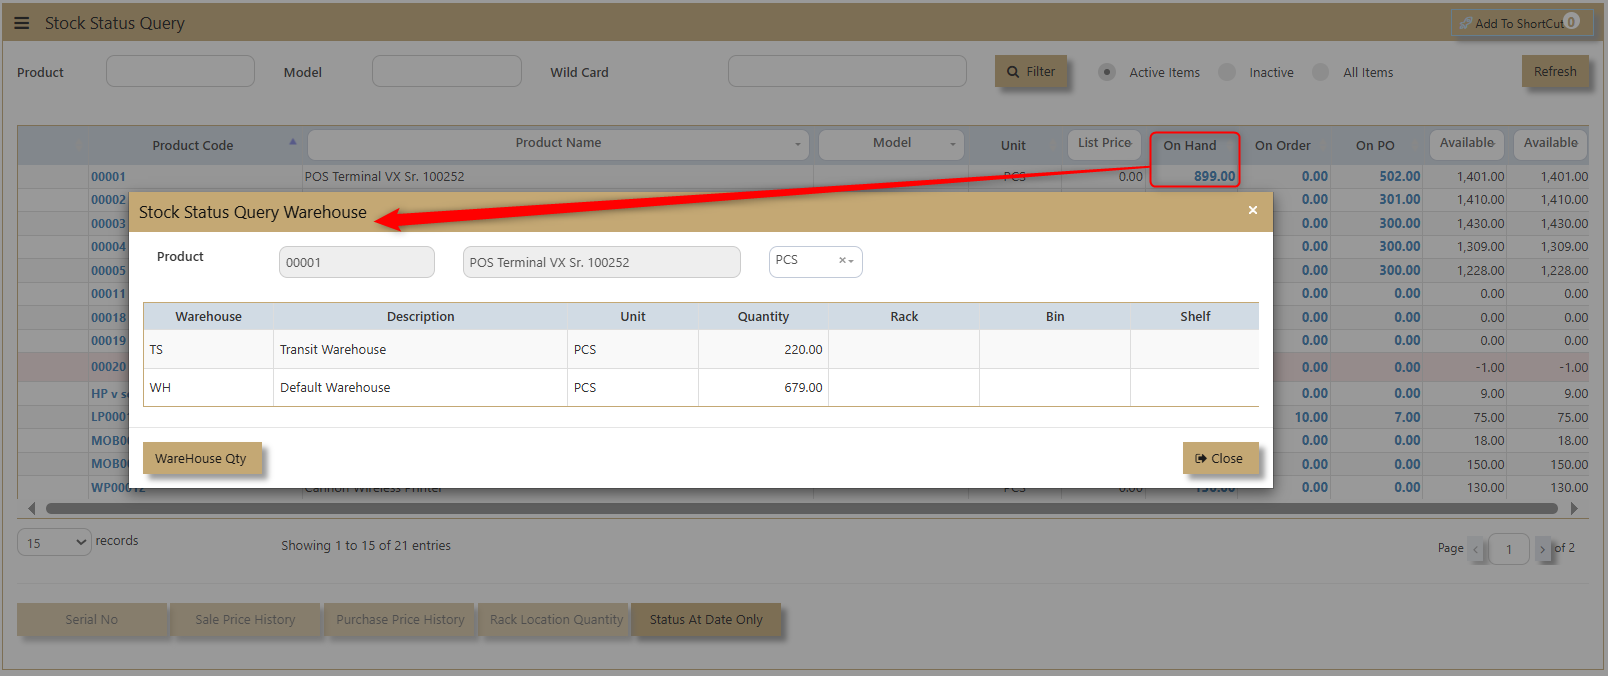
3. Users are allowed to zoom in further to see the status of each warehouse. E.g., we can click WH to see Warehouse Qty now.
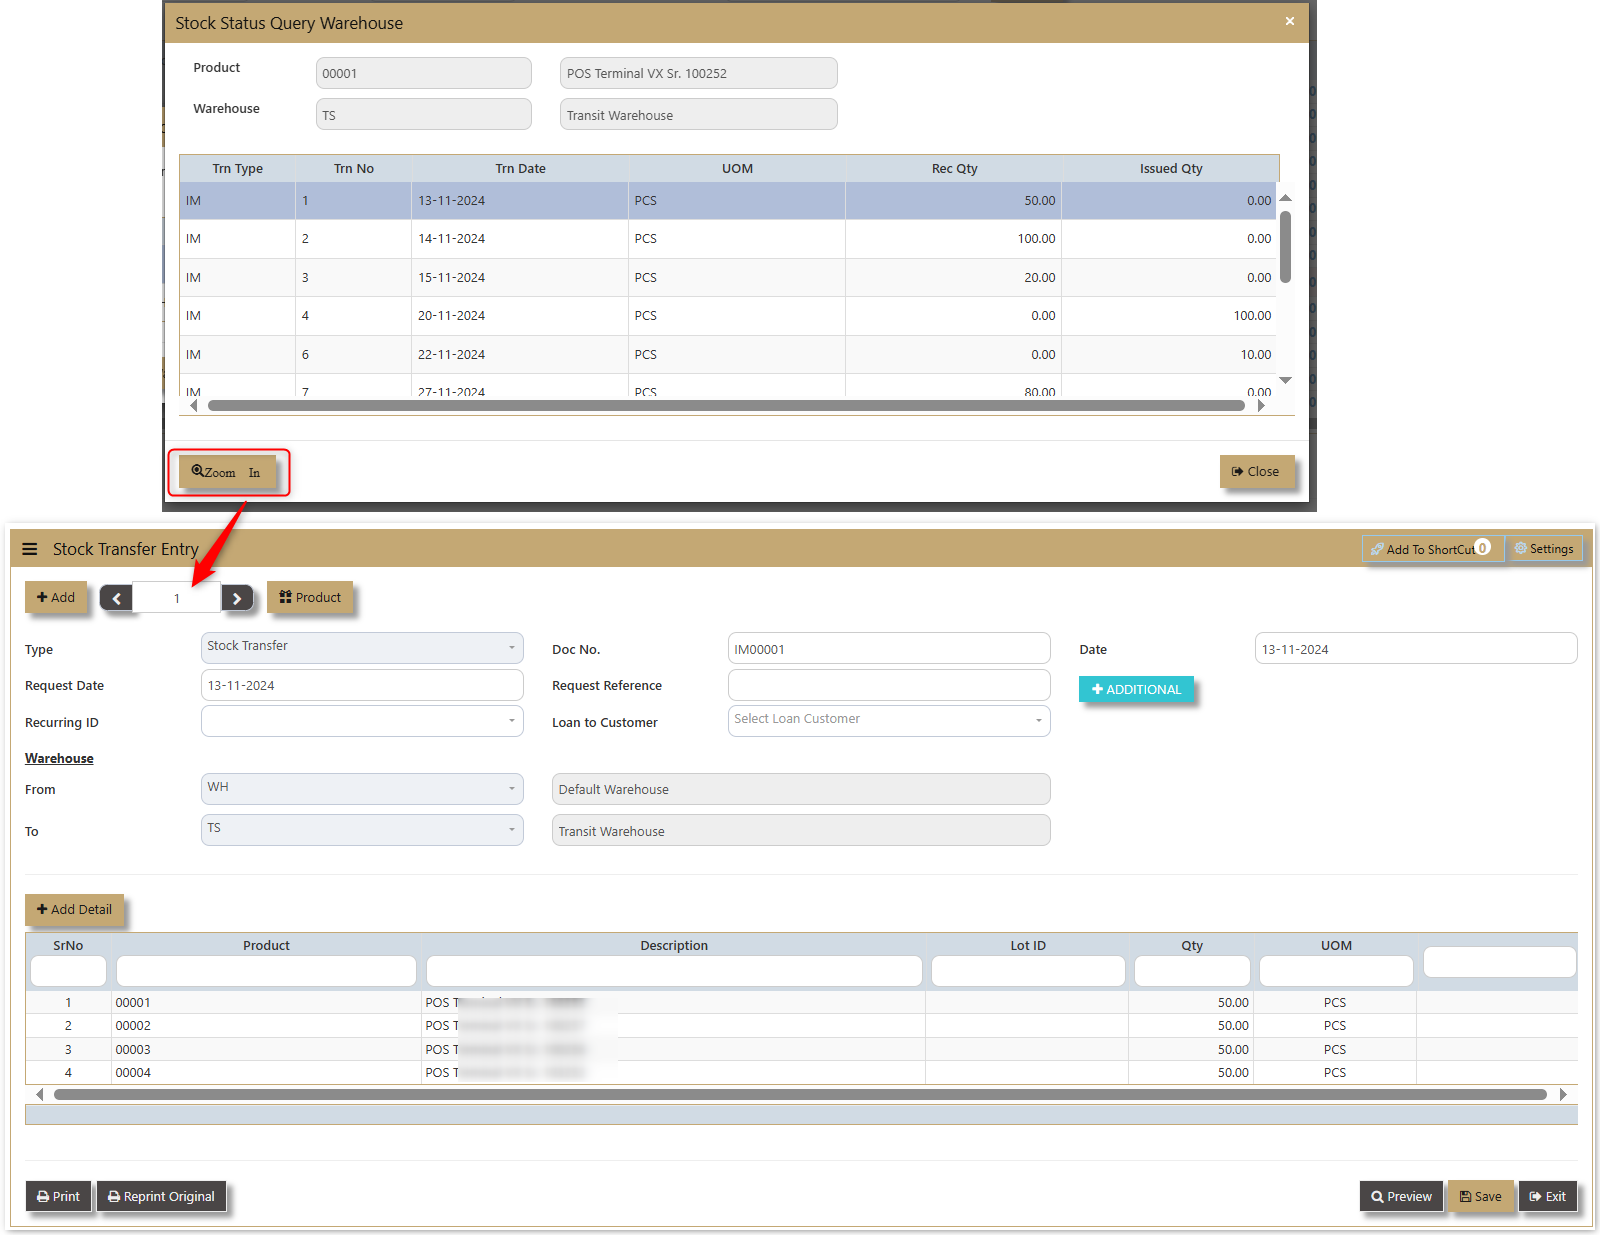
4. The transaction in the Warehouse is now displayed. If you want to see any transaction details, then select the raw and click the zoom button to check the details.
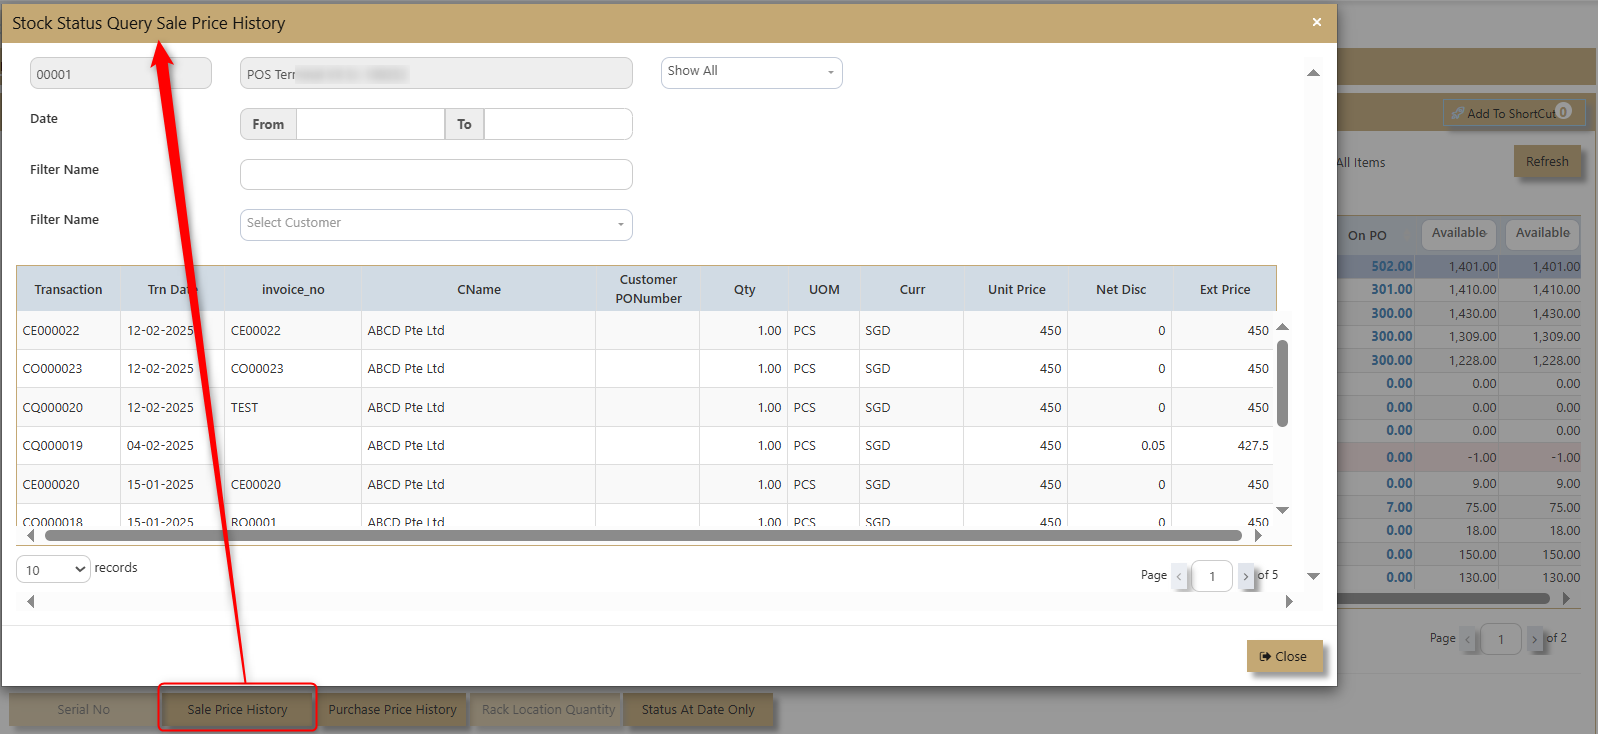
5. User could be able to see the sales price history as indicated below.
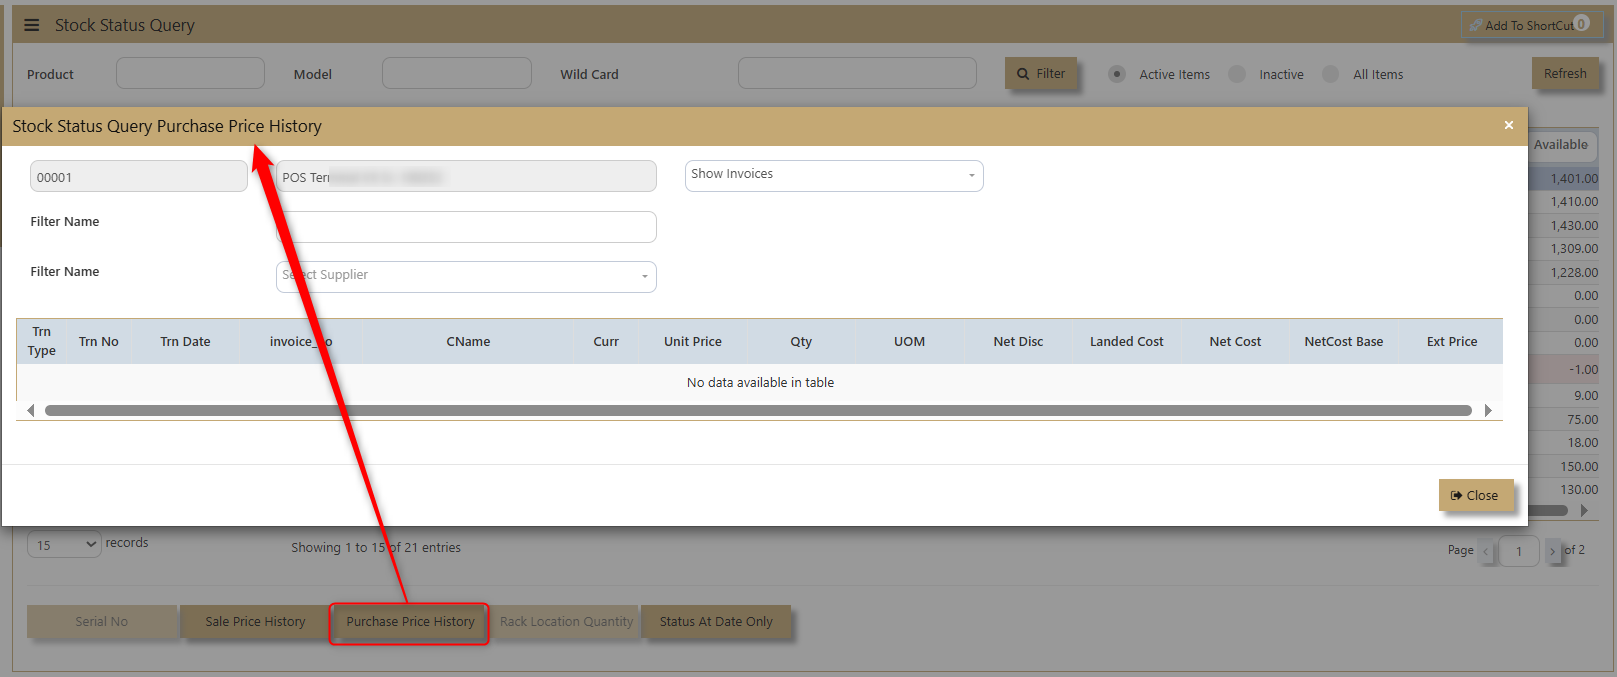
6. User could be able to see the Purchase price history.
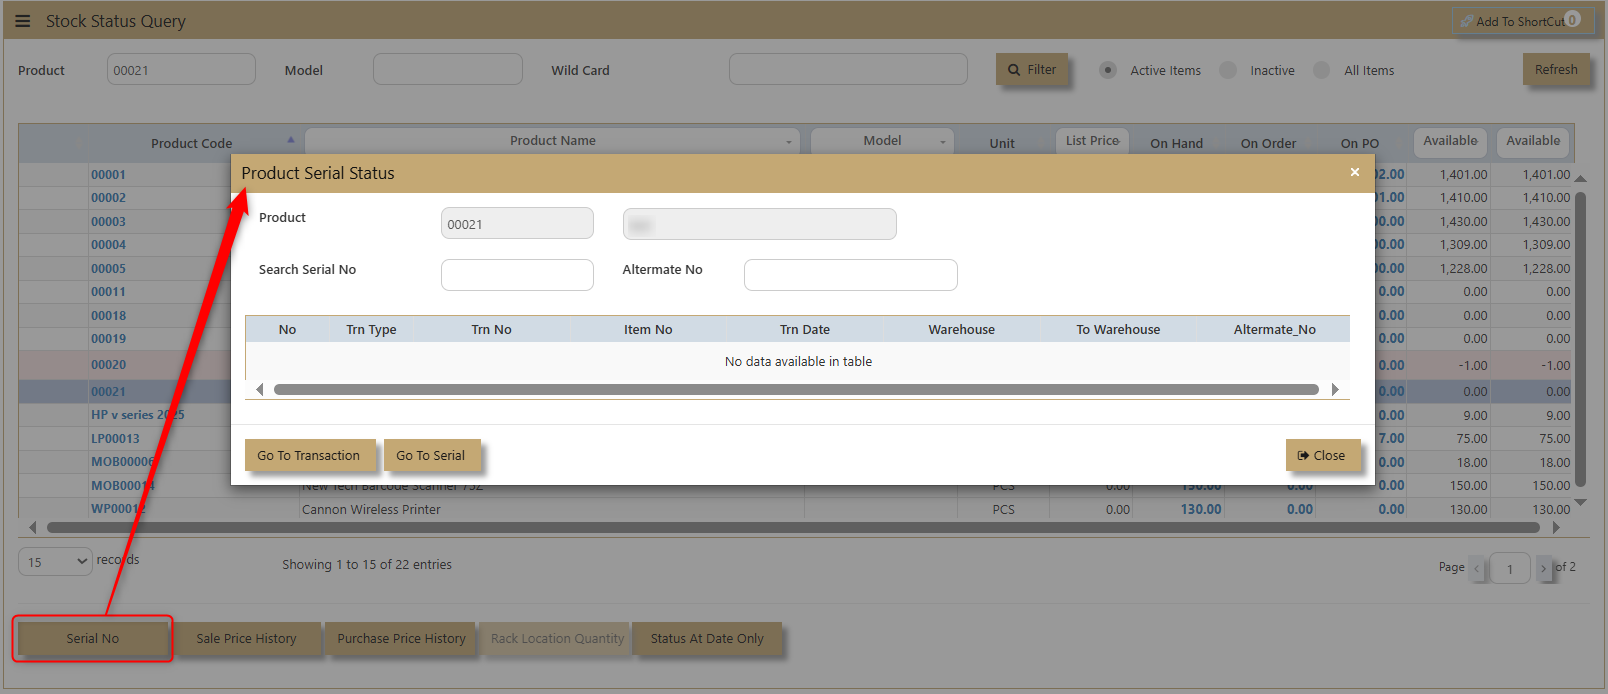
7. If the product is Serialized. the system will enable the button for Serail to see the serial number pf the certain product.
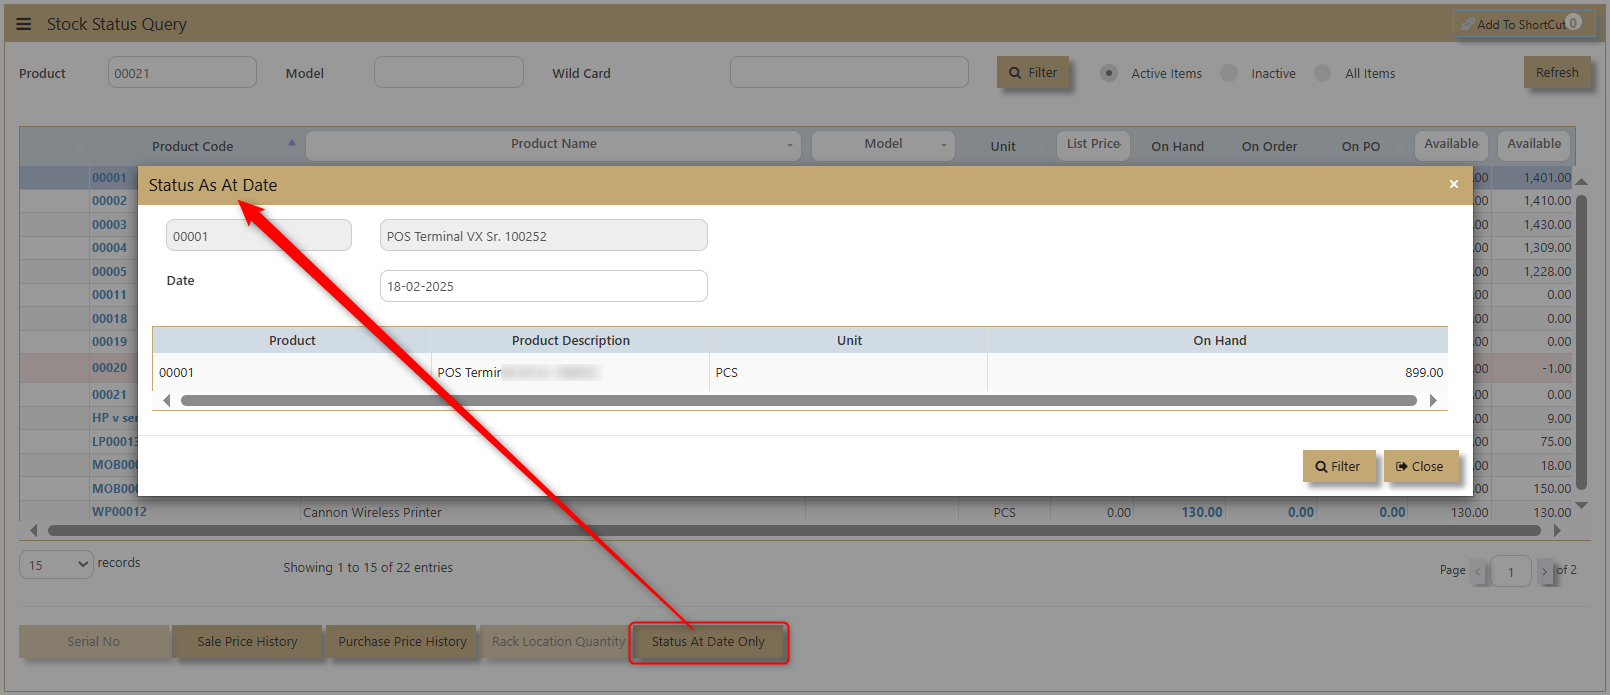
8. Status at Date only will show the status of the product at the current date when the query is made.
REPORTS & QUERIES
How to use Report & Queries?
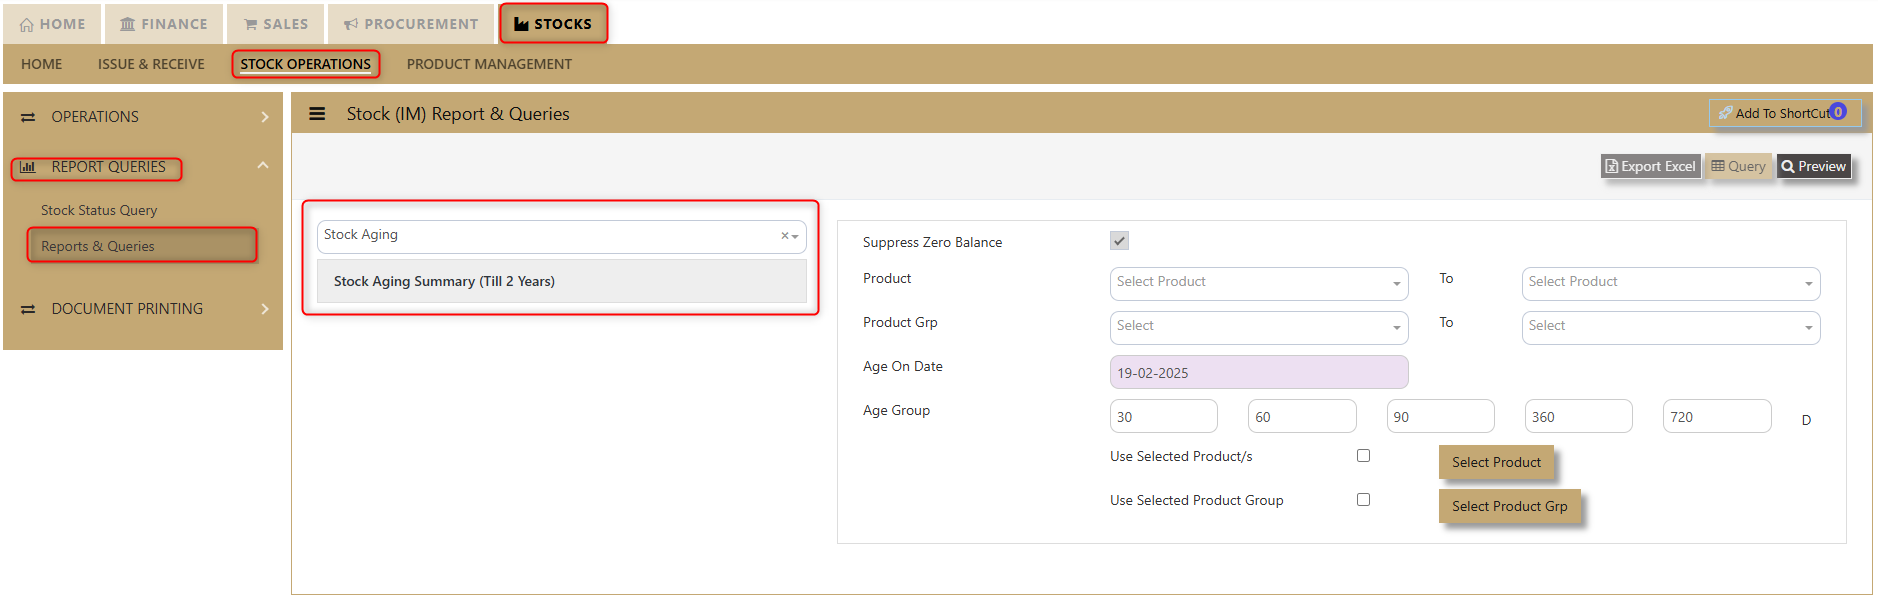
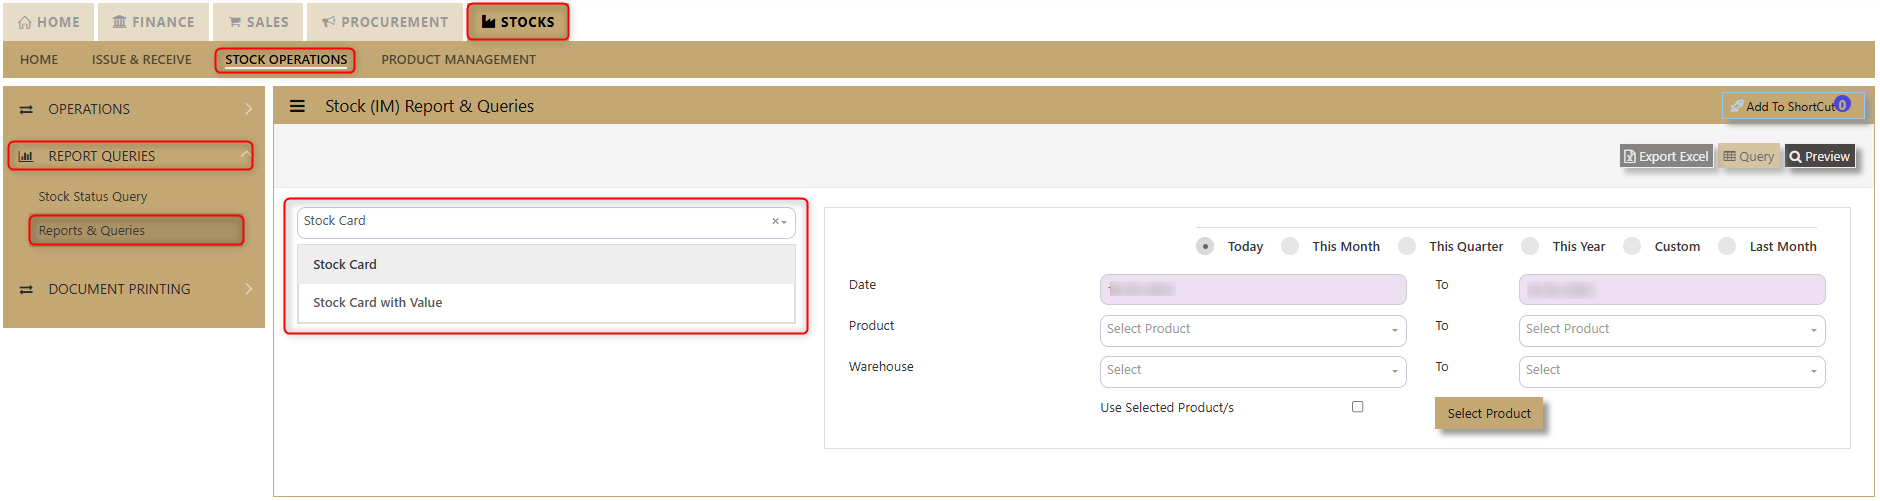
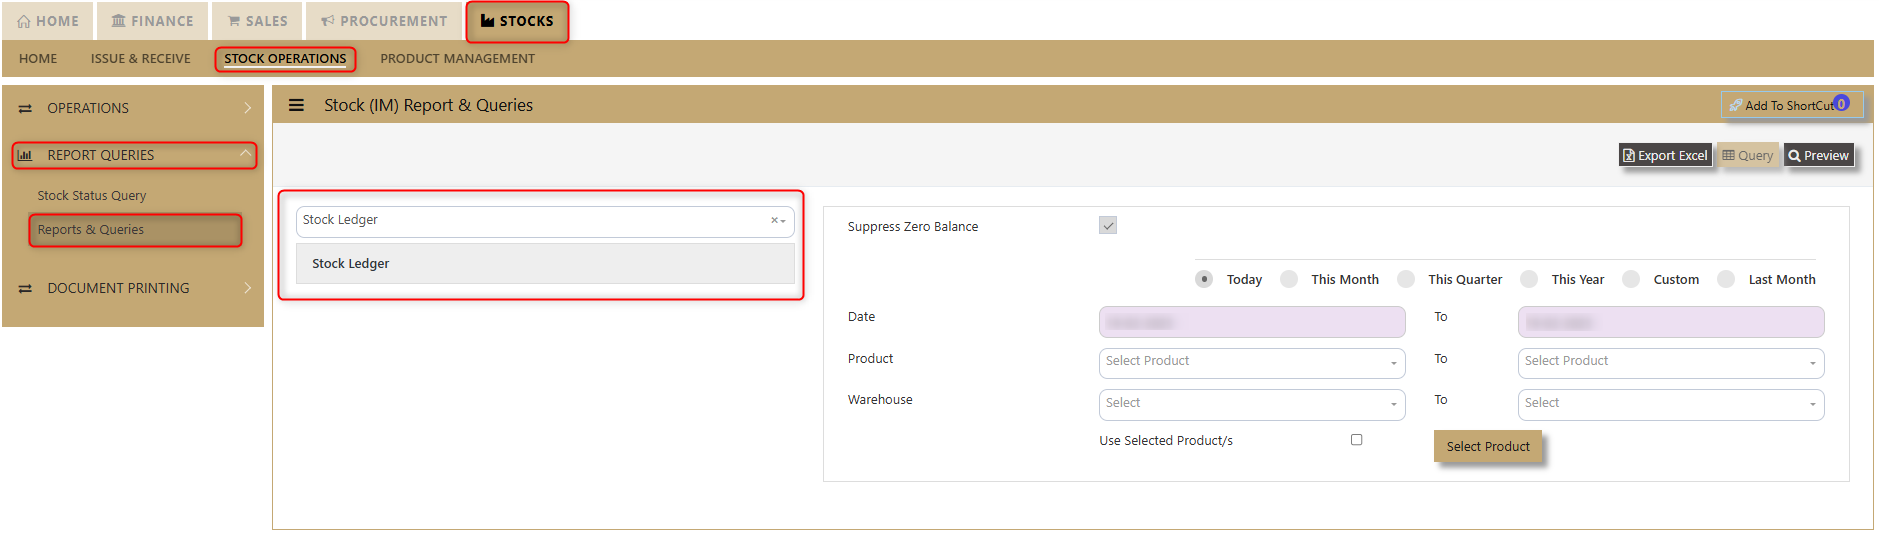
1. Click on Stock – Stock Operations - Reports Queries – Reports & Queries icon for following screen.
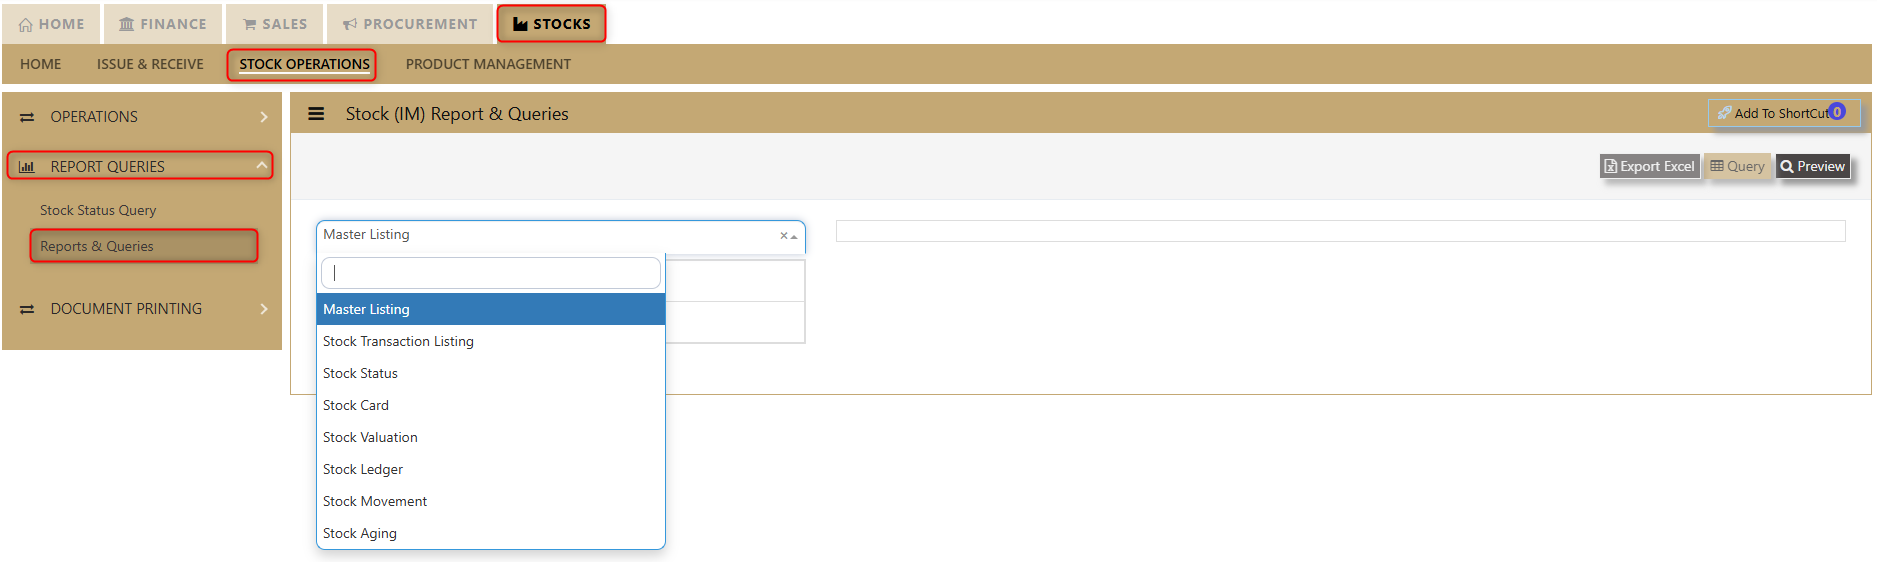
The main reports are Stock Valuation, Stock Ledger and Stock Aging. These reports will enable the users to see the on-hand quantity and valuation, the transactions made as well as the aging report of the stock items.
These reports & queries will also enable the user to see reports for Master Listing, Stock Transaction Listing, Stock Status, Stock Card and Stock Movement.
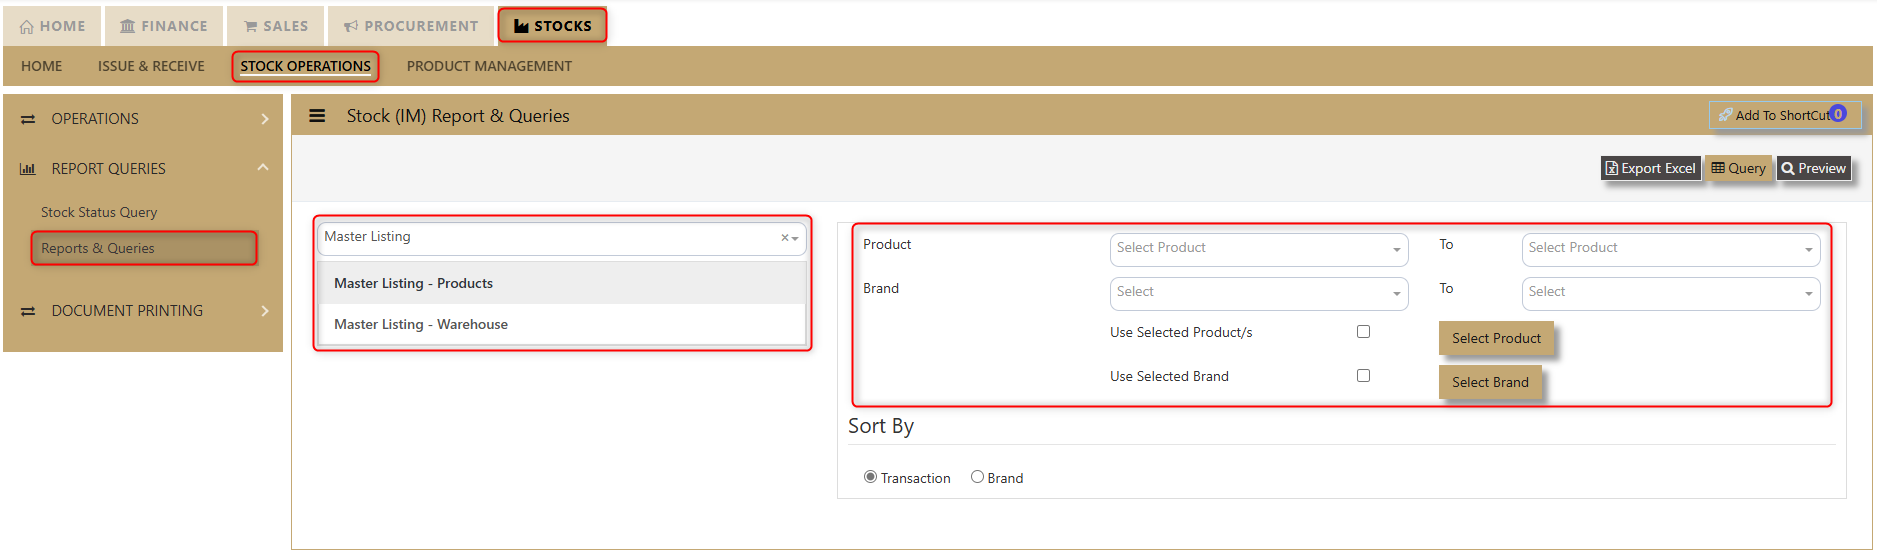
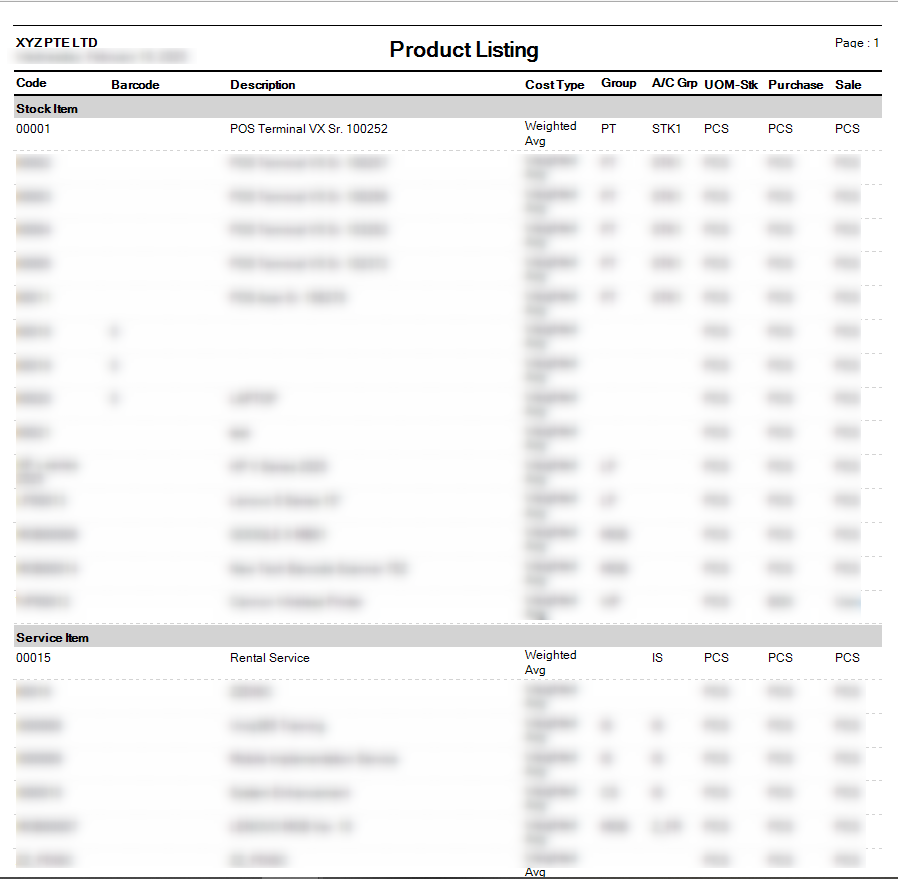
1. Master Listing
Users can filter and view products and warehouses by Product and Brand Short. This report provides a clear overview of stock levels and warehouse locations, helping users manage inventory efficiently. By applying the filters, they can quickly access the specific data they need. Click on preview and the user may access the report.
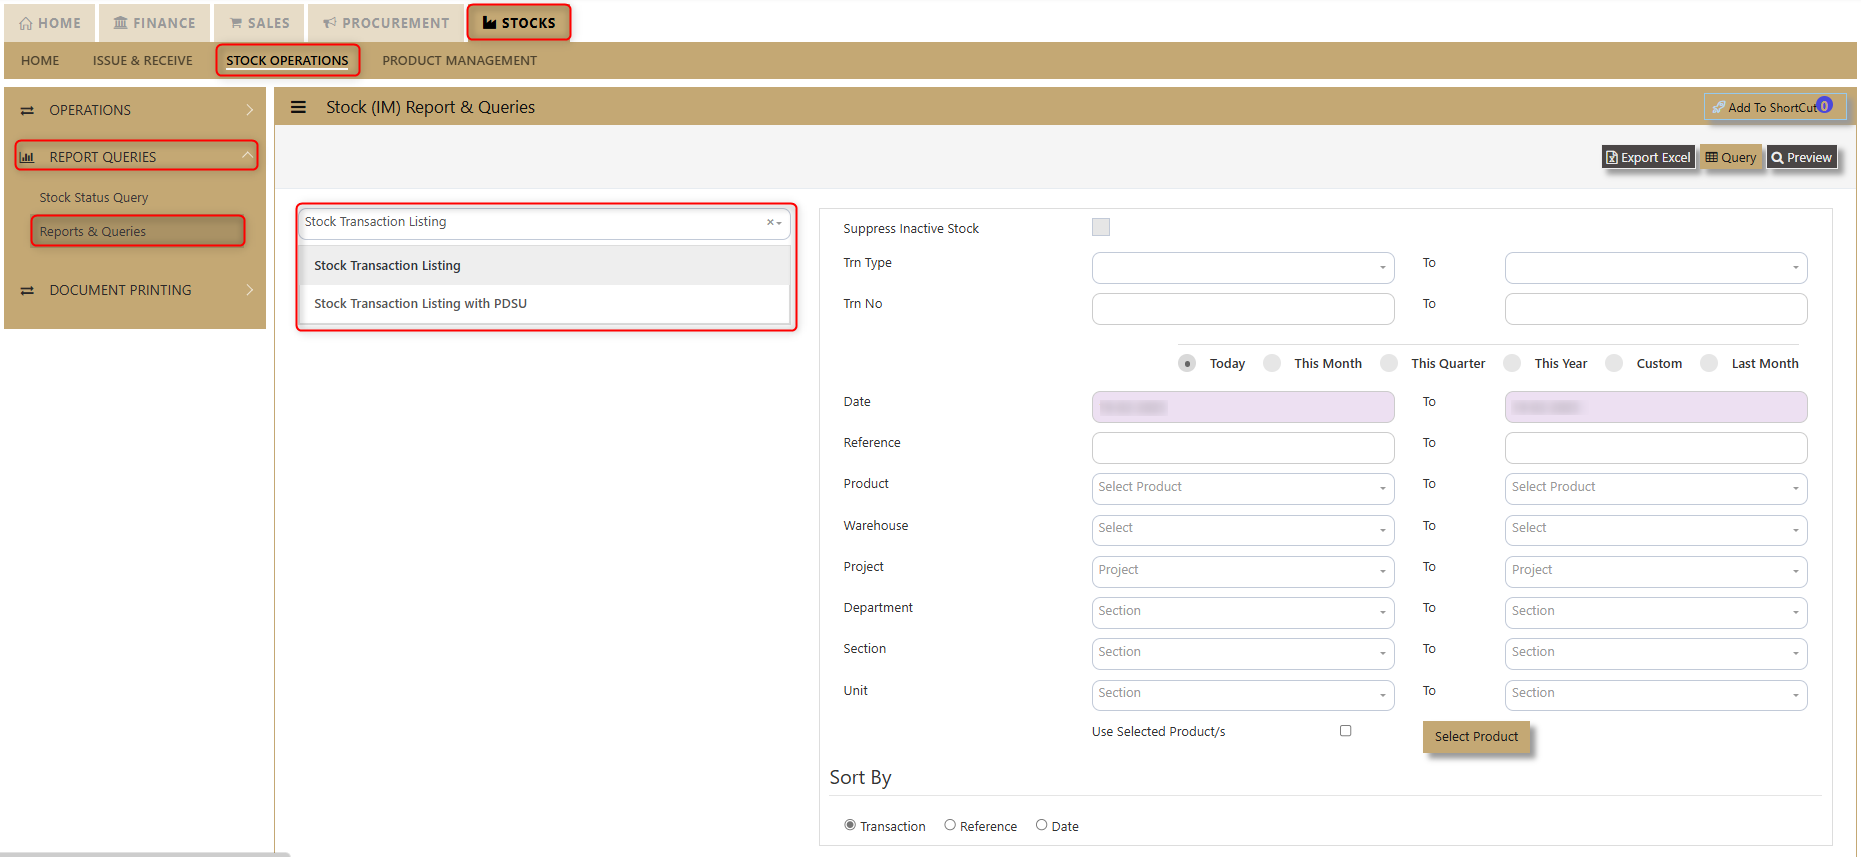
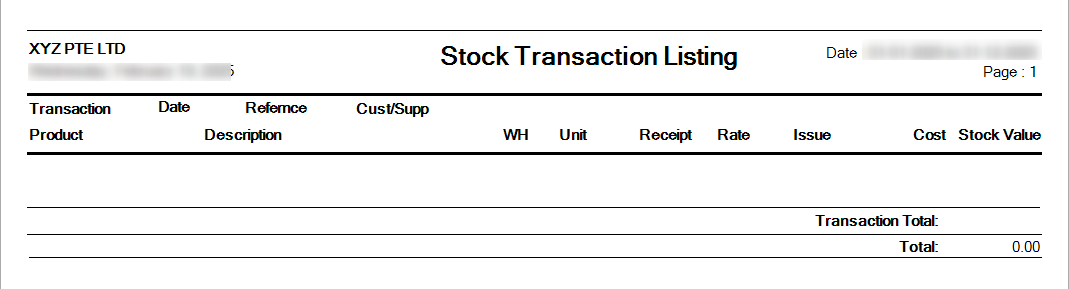
2. Stock Transaction Listing
Stock Transaction Listing Report provides users with a comprehensive overview of stock transactions, allowing them to view details by transaction type and transaction number. The report offers an option to suppress inactive stock, ensuring that only active items are displayed. Users can refine their data by utilizing a range of filters, including Date, Reference, Product, Warehouse, Project, Department, Section, and Unit, enabling easy access to specific information. Additionally, users have the flexibility to sort the report by Transaction, Reference, or Date, offering a streamlined approach for efficient data analysis and decision-making.
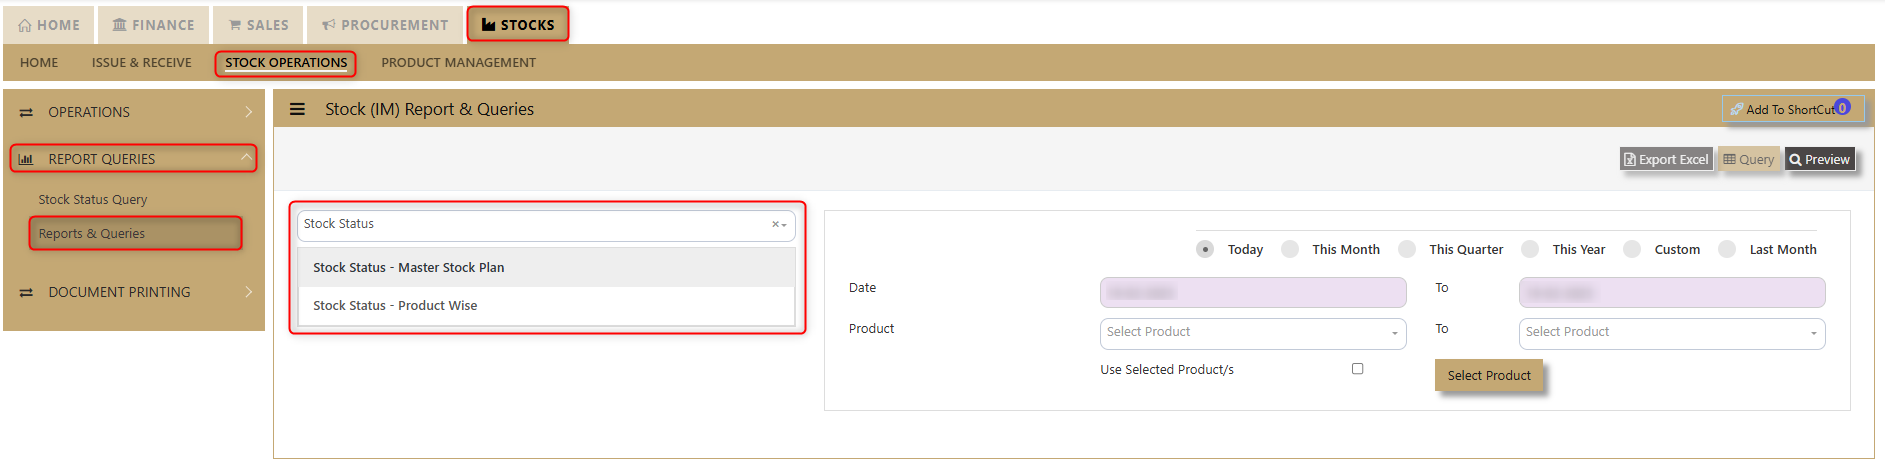
3. Stock Status
Stock Status Report offers users the ability to generate detailed insights into stock levels with two key report options: Stock Status - Master Stock Plan and Stock Status - Product Wise. This functionality allows users to track and analyze stock data based on their preferred view. The report includes filtering options for Product and Date, enabling users to narrow down the results to meet specific needs. Whether users are focusing on the overall stock plan or detailed product-level information, the Stock Status Report provides an efficient and flexible tool for managing stock data.
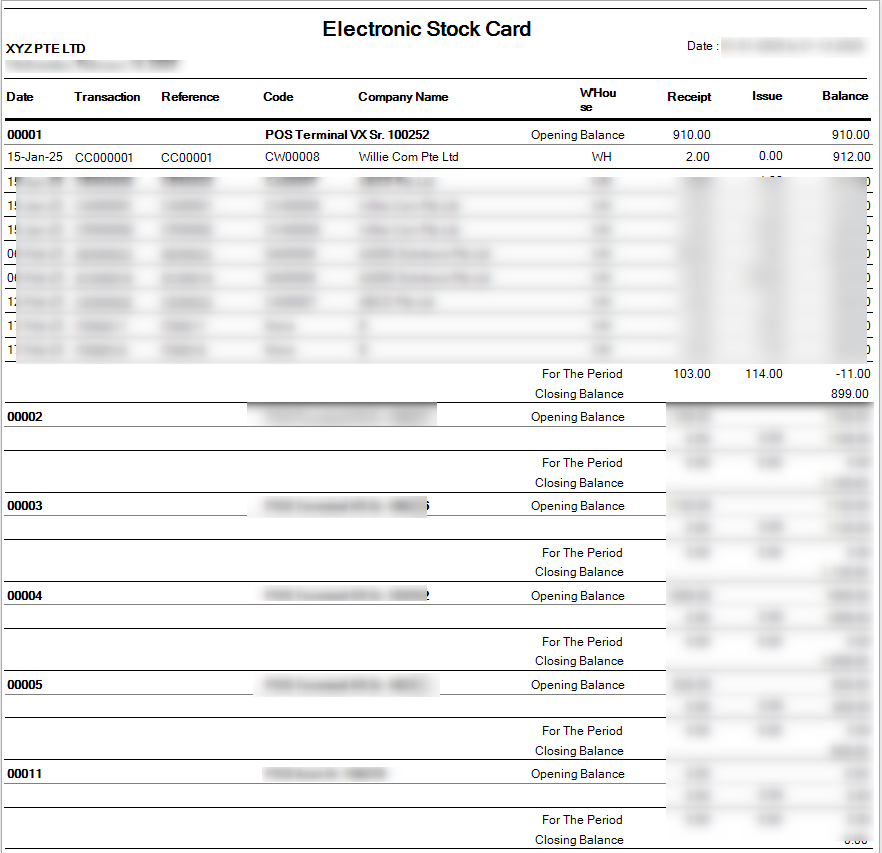
4. Stock Card
Stock Card Report allows users to view detailed records of stock movements for specific products across different warehouses. Users can easily filter the report by Date, Product, and Warehouse, offering a tailored view of stock levels and transactions over time. This flexibility ensures that users can access the precise information they need, whether for tracking stock movements, auditing inventory, or managing warehouse operations efficiently. The Stock Card Report is an essential tool for monitoring stock activity and making informed inventory decisions.
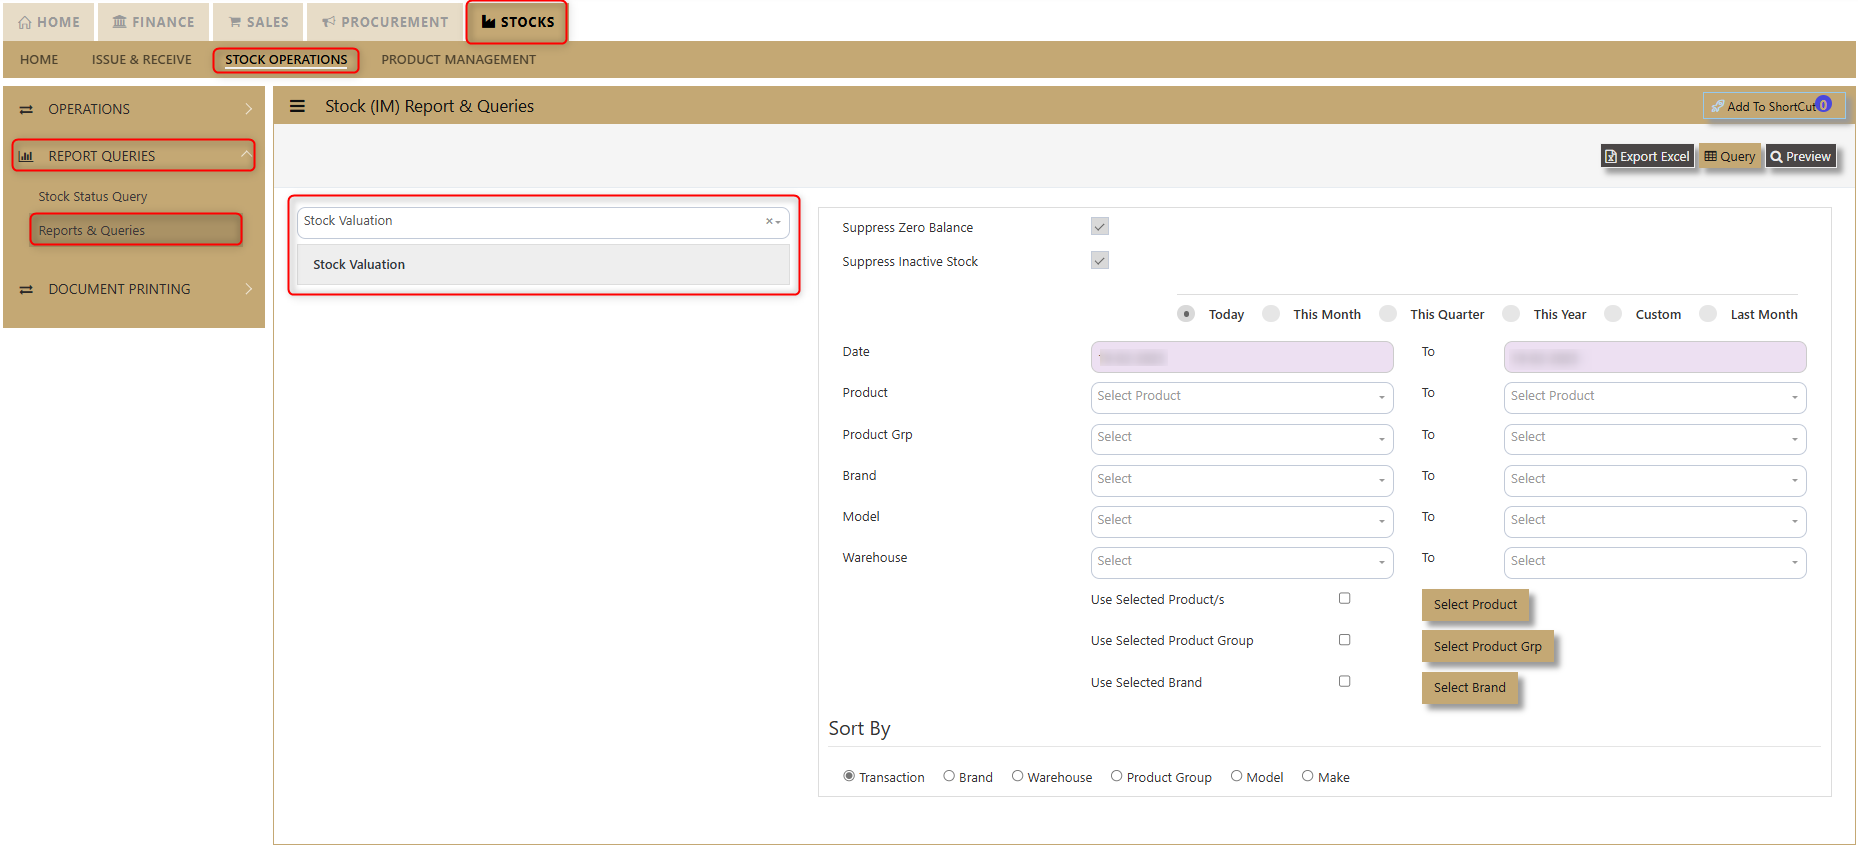
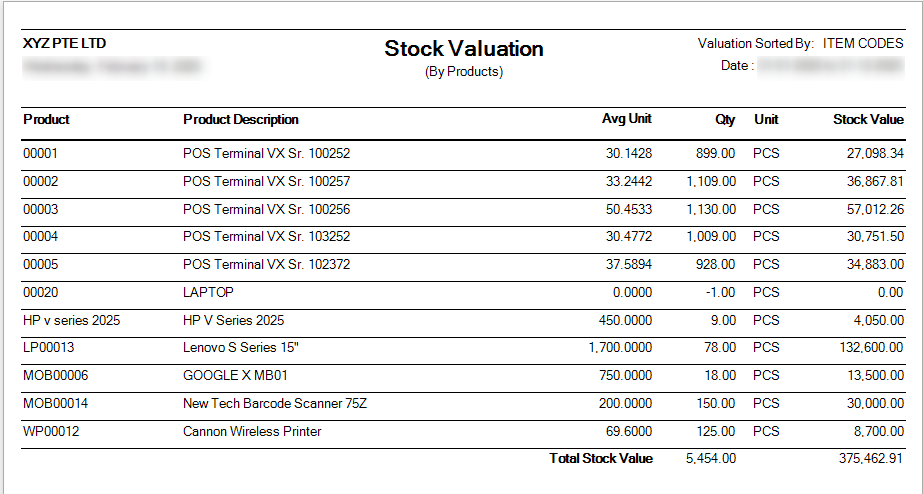
5. Stock Valuation
Stock Valuation Report provides users with a clear and detailed overview of stock values, offering the flexibility to refine the data according to specific needs. Users can choose to suppress zero balances, ensuring that stocks with a zero balance do not appear, or suppress inactive stocks, which displays only active items in the report. The report also features a variety of filters, including Date, Product, Product Group, Brand, Model, and Warehouse, allowing users to focus on particular stock categories. Additionally, users can sort the report by Transaction, Brand, Warehouse, Product Group, Model, and Make to streamline their analysis and decision-making. This report is a powerful tool for tracking stock value, inventory status, and product performance across various parameters.
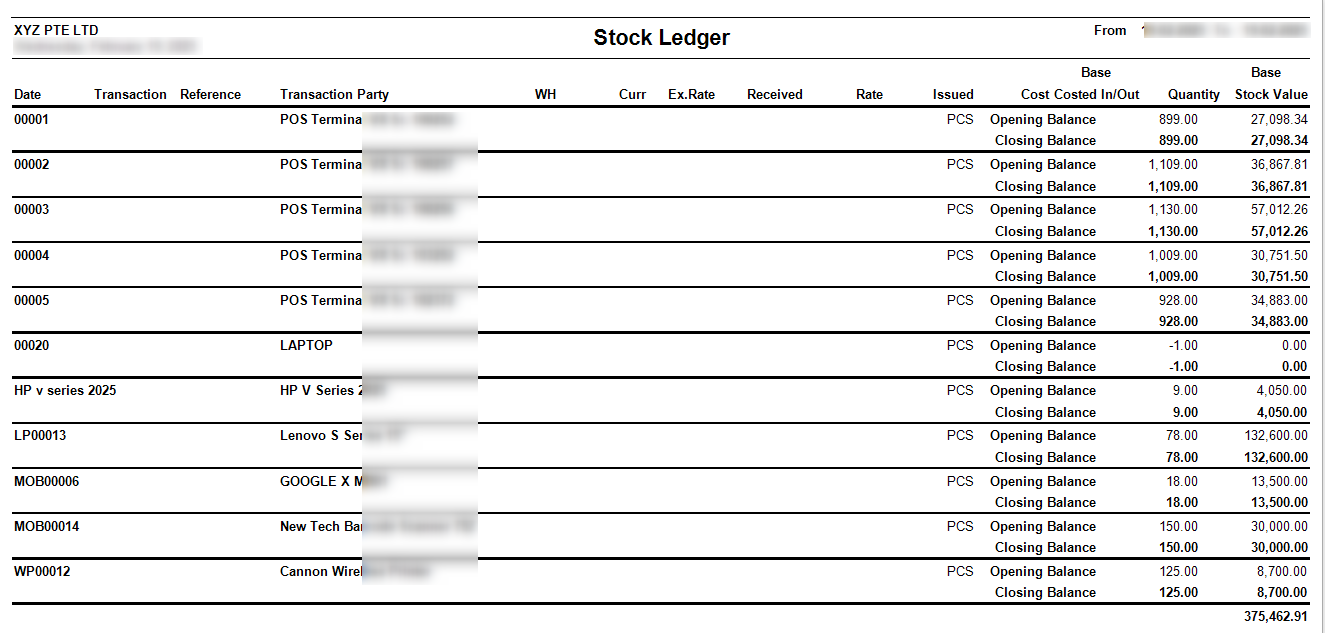
6. Stock Ledger
Stock Ledger Report offers users a detailed record of all stock movements and transactions, providing an essential tool for tracking inventory activity. With the ability to filter by Date, Product, and Warehouse, users can easily access specific information related to their stock transactions. This functionality ensures that users can analyze stock history, monitor changes, and gain insights into inventory trends across various products and locations. The Stock Ledger Report is designed to support efficient inventory management and improve decision-making through accurate, up-to-date transaction data.
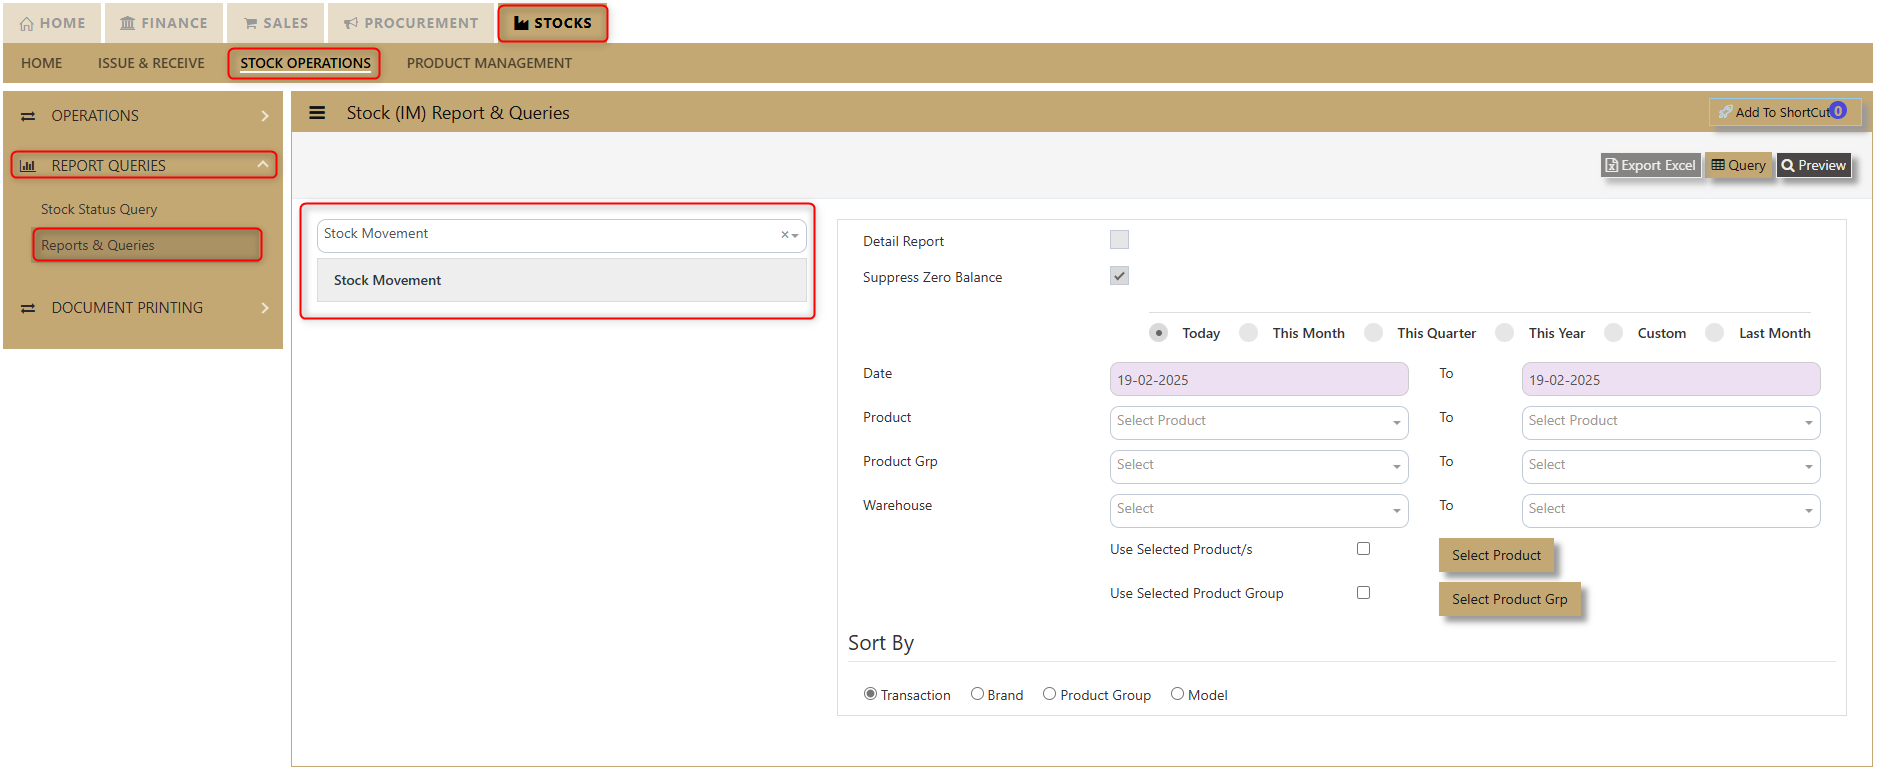
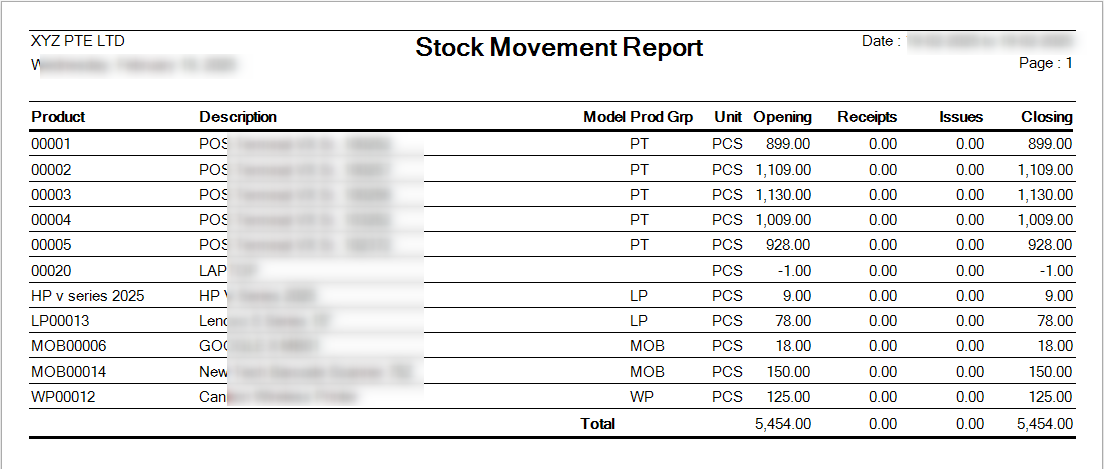
7. Stock Movement
Stock Movement Report provides users with a comprehensive view of their stock movements, allowing them to track inventory in real-time. Users can filter the report by date, product, product group, and warehouse, with the option to suppress zero balance items for a more streamlined display. Additionally, the report can be sorted by transaction, brand, product group, and model, enabling users to analyze data according to their specific needs. This detailed, customizable report helps users efficiently manage and review their stock movements for better decision-making.
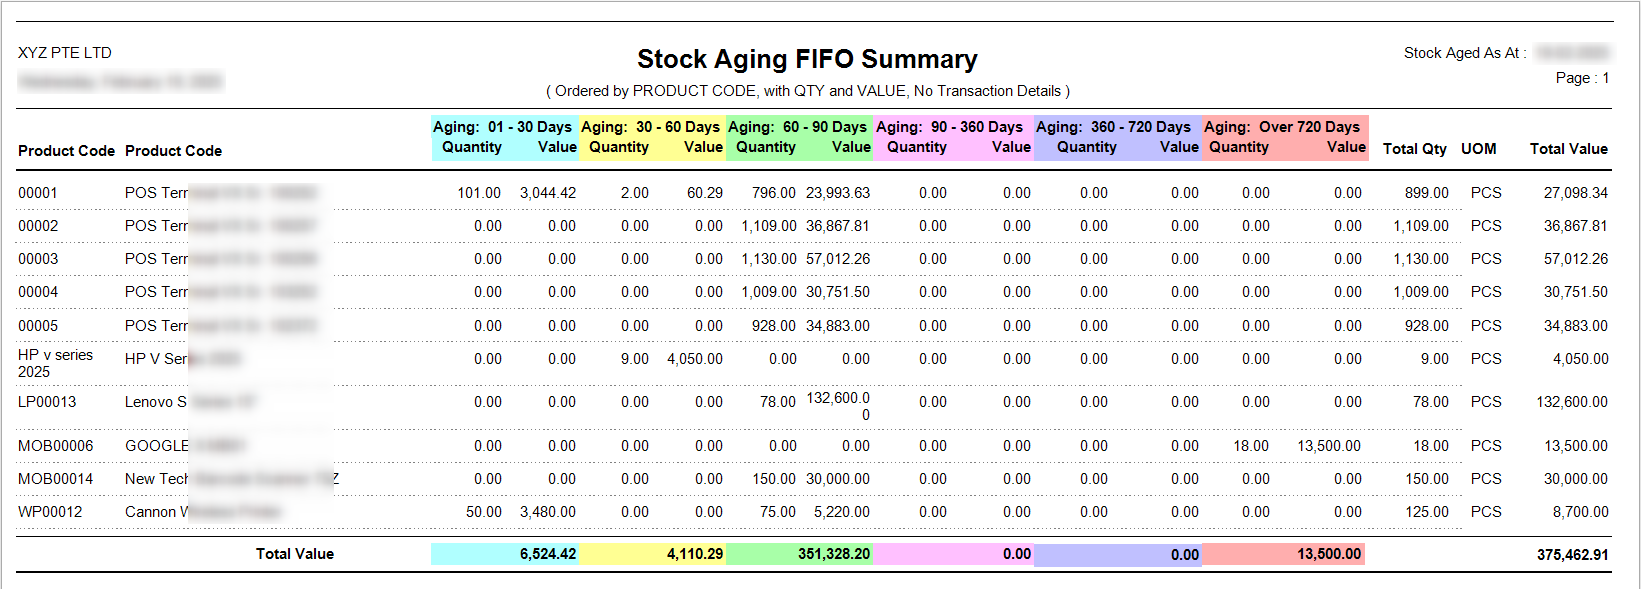
8. Stock Aging
Stock Aging Report allows users to view stock data for up to 2 years, offering valuable insights into inventory age. Users can filter the report by Product, Product Group, Age on Date, and Age Group to customize the view to their needs. Additionally, the report includes an option to suppress zero balance items for a cleaner presentation. This detailed, customizable report enables users to efficiently track stock aging, pinpoint slow-moving items, and make data-driven inventory decisions.